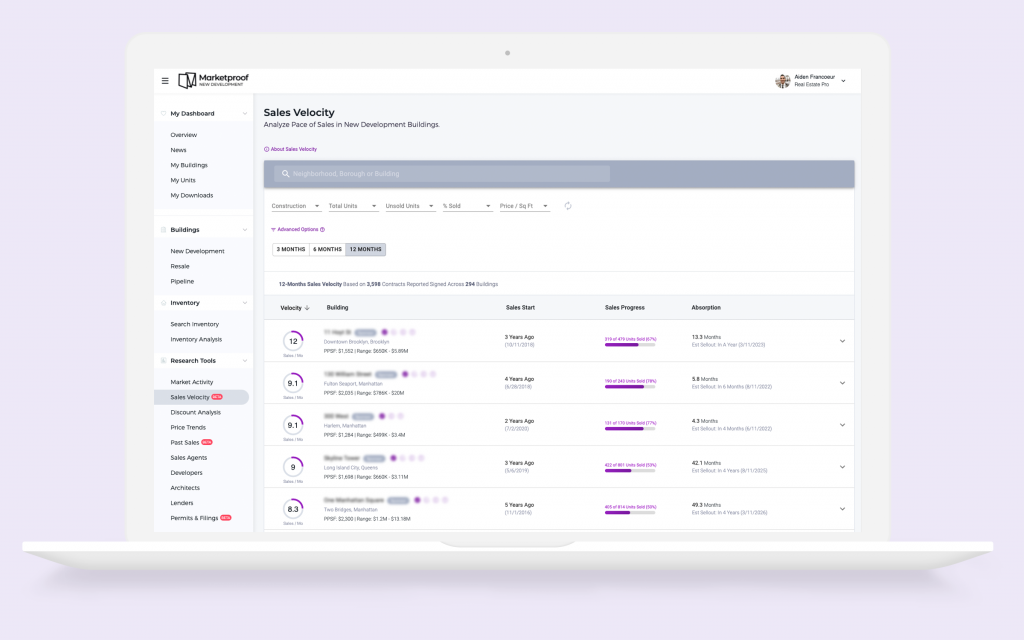
Marketproof subscribers now have access to a new tool for comparing Sales Velocity among NYC new developments.

What is sales velocity?
Simply put, sales velocity is a measure of how quickly units are selling in a building. This metric is calculated using the number of contracts reported over a certain number of months. The average number of contracts per month is the sales velocity.
What’s new?
Sales velocity information has always been available on Marketproof at the building level, but our dedicated Sales Velocity tool now enables you to understand how a building’s contract activity aligns with comparable properties and how this activity relates to broader trends in New York City’s new development market.
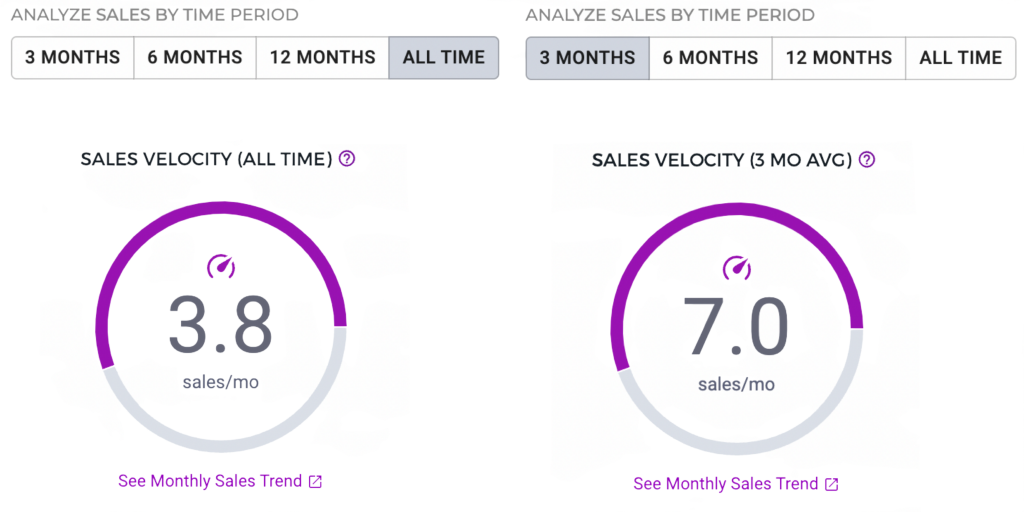
You can toggle to the 3-, 6-, or 12-month averages and see the sales velocity for new development buildings. Click on individual buildings to learn even more about them. On an individual building page, you can also see the all-time sales velocity.
You can then click the drop-down menu to see all contracts during this time period. For further information, click right through to see the specific unit.

Another feature is expanded search capability. It’s best to compare sales velocity across buildings that are similar in size and with similar amounts of remaining inventory. For example, a 10-unit condo is unlikely to outperform a 100-unit building on absolute sale velocity, though it may be a stronger performer in terms of percent of units sold. Marketproof’s filters allow users to group similar buildings by size, location, etc.

Why is sales velocity important?
Sales velocity is important because it is a snapshot of how well a building is performing over time and, in turn, a basis for predicting a building’s sellout. In the example below, the building picked up speed during the past three months but saw slower contract activity when it first launched sales.

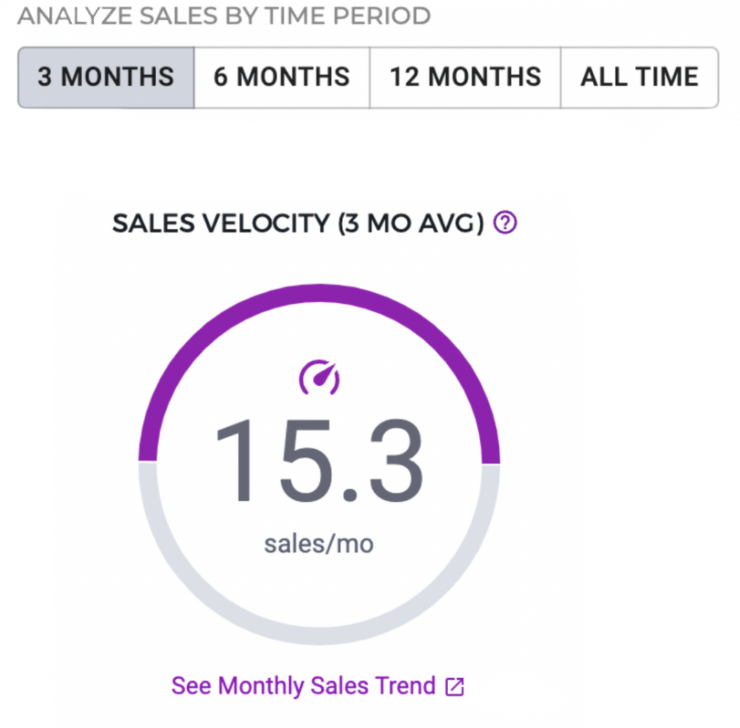
It’s also important for larger buildings with hundreds of units. Below, we see a new development with 800+ units that is only 50 percent sold. However, its sales velocity shows us that it is a strong performer, even though it will likely take longer to completely sell out than, say, a 100-unit building.

These metrics are valuable because they allow interested parties to forecast revenue, base sales tactics on competitors, and see the projected sell-out timeline based on neighborhood, price point, and unit size.
How can subscribers use the sales velocity tool?
Here are some specific examples of how Marketproof subscribers can utilize the sales velocity tool to meet their business goals:
- Buyers brokers. By evaluating a specific building’s sales velocity, you can share with buyers how much negotiability may exist and come up with a compelling offer strategy. For example, showing your client that units have been taking longer to sell than at comparable properties can help them understand that there’s likely room to negotiate the price.
- Listings agents. You can utilize sales velocity to advise developer clients on pre-development pricing strategy, to craft a well-informed pitch for winning a new development project exclusive, and to determine optimal pricing for re-sales. Using the search functions of the tool, you can see sales velocities of similar buildings (those in the neighborhood, of the same size, with units of similar square footage, etc.) to make informed pricing proposals. When sales are in progress, the tool can help with benchmarking performance against comparable buildings.
- Developers. Analyzing comparable buildings can help you project your development’s sellout in order to obtain financing. Once sales are underway, you can use the tool to chart sales velocity, which is helpful for planning concessions and discounting and communicating how well the building is performing against the plan.
- Investors. You can use the sales velocity tool to look for buying opportunities, such as purchasing multiple units for resale or rental income. You can easily sort by strongest to weakest sales velocity to find these opportunities.
- Lenders. Sales velocity can help you project how your loan is performing over time. It’s useful for anticipating when the loan will be paid off, and in some cases, whether units will be sold before the loan matures. By looking at sales velocity at different time segments, you can more easily make these projections.
- Capital markets. You can use sales velocity to see how a development is performing against its loan and if the project may be a fit for your services, such as an inventory loan. Using the time segments can help with analyzing spikes and drops in performance to understand the long-term health of a project.
- Appraisers. Looking at individual buildings’ sales velocities, as well as those of comparable buildings, over time can help you determine how many months of inventory remain at a project. You can then better estimate the property value and determine if the price should be adjusted higher or lower.
Some things to keep in mind
While Marketproof has the most comprehensive data on in-contract units and shadow inventory, our sales velocity tracker only includes contracts that have been reported, and some developments do not report contracts and are therefore excluded from our analysis. Also excluded are buildings that started sales after the selected number of months.
The concessions that a developer is offering on a project are almost never visible, but these can have an impact on sales velocity. Concessions can include the developer paying the transfer tax or legal fees, or adding a storage unit or parking space to the deal at no additional cost. These concessions do not visibly lower the price of the unit (this would be considered a discount).
Also, a building’s sales velocity depends on the amount of unsold inventory. A building with few units left will not rank highly based on recent sales velocity simply because there are not many units left, despite the fact that the building may have been a strong performer overall.
Getting started with Marketproof
Sales velocity data is another way Marketproof New Development is here to help you with your business. With Marketproof New Development, you can access available inventory, past sales, and more for 160,000 condos. You can also see the pipeline of future projects. Create an account today, and get a 7-day free trial.
Marketproof New Development
Rendering of 11 Hoyt Street by Binyan Studios


