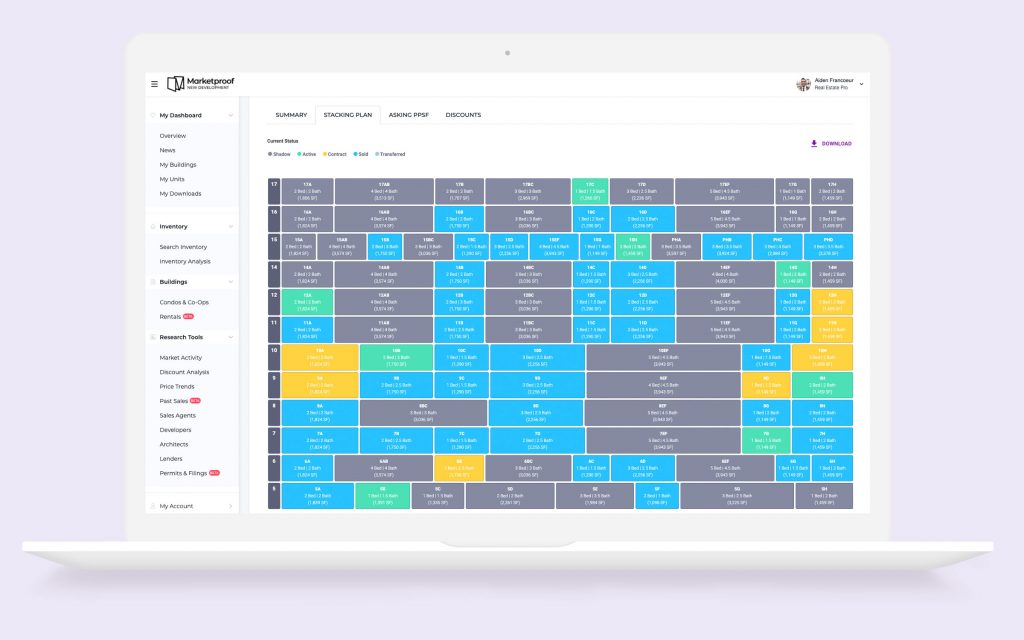
Five months into 2021, the market is finally starting to recover from the COVID economic shock. Let’s add another tool to help fill your meetings and reports: digital stacking plans for thousands of NYC buildings that help you get insights at a glance that previously required elaborate work to obtain.
Marketproof’s digital stacking plans are a whole new way to visualize NYC condo and co-op inventory. With automated stacking plans, developers, brokers, investors, lenders, and buyers can quickly see how a building’s units vary across key metrics.
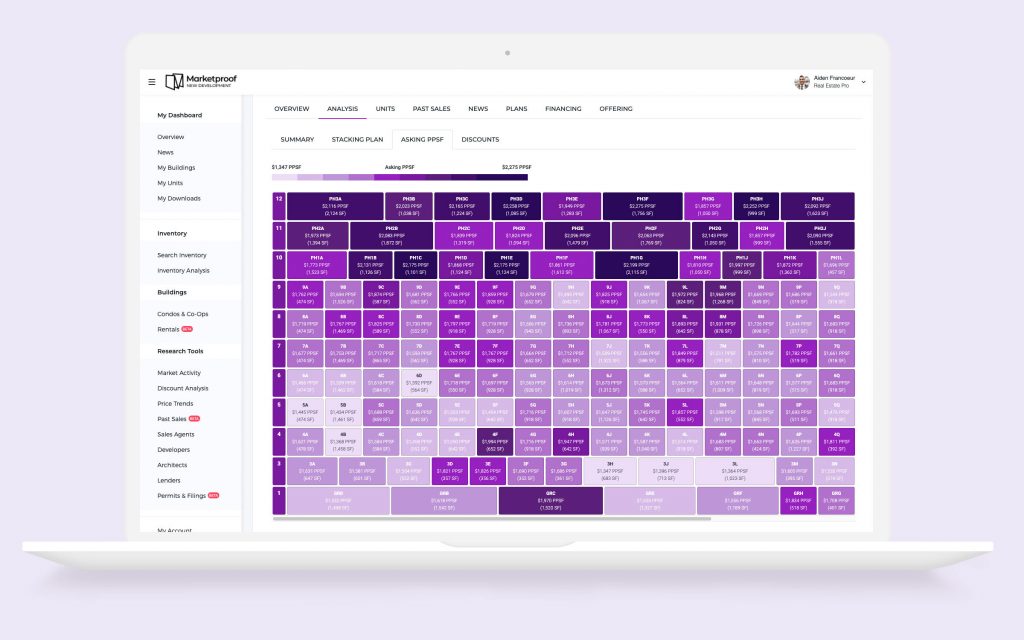
The ready-made and easily updated plans for NYC buildings show listing and ownership status, asking and sold price per square foot, and length of ownership in resale buildings. Color coding provides an instant sense of those metrics.
How is a unit priced against others on a floor or line? How does the price per foot vary across a building? How long are owners staying in a building? How many units does a sponsor still own? Get answers to these questions and many more with Marketproof Stacking Plans.
The plans are available to Marketproof Pro subscribers and extend Marketproof’s mission to make real estate data easier to access and act on.
“Adding this visual layer to real estate research enables subscribers to scope out a building in seconds,” said Kael Goodman, Marketproof CEO and co-founder.
See the entire building at a glance
Stacking plans combine the analytical capabilities of spreadsheets and the visual intuitiveness of a map. They provide a quick overview of what is happening across the units in a building.

For example, the Marketproof stacking plan above uses colors to indicate which units in this residential building are available but not listed (aka shadow inventory), actively listed, in contract, and sold.
Check out Marketproof Pro for the most information anywhere on NYC condos.
Swap your spreadsheets for digital stacking plans
The stacking plans show the status of each unit in a building. The plans allow users to quickly visualize the performance of floors and lines.
Different plans are available for projects at sponsor and resale stages. So, while new development plans will show asking prices, resales will show the prices at which units sold.
In addition, the price and ownership age plans have color gradients like those of heat maps so that the viewer can instantly understand where the priciest or longest-held units are and vice versa.

“This tool makes analyzing NYC buildings super easy,” said Jason Thomas, head of new development research at Elegran Real Estate. “We’ve been making stacking plans like this in spreadsheets for years at Elegran, and Marketproof is now giving us thousands of plans with data we didn’t have access to.”
Download the stacking plans and improve your reports
Subscribers can download the plans, send them to clients, and use them to boost their own reports.
Not just new development
Marketproof’s stacking plans cover just about all 19K buildings developed over the last 50+ years.
Editing Stacking Plans
Let us know if you see something that isn’t quite right in a stacking plan. We can combine and change units with ease.
Getting started with Marketproof
With Marketproof Pro, you can access available inventory, past sales for 150,000 condos, and pipeline of future projects. Create an account today, and get a 7-day free trial.
Photo above courtesy of The Park Loggia.


