The NYC new development market suffered three disruptions between 2017 and 2020 that especially affected Manhattan:
- International buyers looked elsewhere following the 2016 US election,
- a new mansion tax went into effect in July 2019, imposing progressively higher tax rates as sales prices climb, and
- COVID temporarily shut down the market and made Manhattan less desirable overall in 2020.
In the aftermath of these events, new Brooklyn condos outsold Manhattan. This was true of all four quarters in 2020, but the gap widened considerably in Q3 and then again in Q4, when Brooklyn new developments sold nearly 1.5x Manhattan’s.
To be sure, COVID also adversely affected the Brooklyn market in absolute terms. Brooklyn new developments sold about 120 to 140 units per month in the first quarter of 2020. The remaining nine post-COVID months averaged less than 100 per month. But the borough did not suffer losses nearly as steep as Manhattan’s or even Queens’ (where Q4 units sold were 48% of Q1 volume). Therefore, it emerged from the pandemic as a relative winner.
You can see each of the three major disruptions to the Manhattan market in the below chart, which shows the number of Manhattan new condo sales per month dating back to January 2016. The first steep decline hit in September 2017, six months after President Trump’s inauguration.
Manhattan sponsors had sold about 130 to 200 condos each of the previous 12 months, with most months’ sales exceeding 150. The borough has barely sold 150 in a month since, with the exception of a few months where the looming mansion tax catalyzed deals. International investors, in particular, fled the post-Trump US market. According to NAR, nationwide, the amount of money they spent on residential real estate dipped 21% from 2017 to 2018 and 36% the following year.
Check out Marketproof New Development for the most information anywhere on NYC condos.
However, the advent of the revised mansion tax disrupted the market more than the shift in Washington. The 2019 mansion tax differed from the previous mansion tax because it was progressive. Thus, instead of merely applying a 1% tax to homes that sold for any figure greater than $1 million, the tax rose to 1.25% for $2-3 million purchases, 1.5% for $3-5 million homes, etc. It topped out at 3.9% for homes of $25 million or more. Buyers raced to purchase costly Manhattan inventory in May and June 2019 before the tax took effect. After 300 purchases in June, sales plummeted to fewer than 100 in July.
Finally, COVID further shrank the market for Manhattan’s relatively pricey condos. This year, the number of Manhattan new development unit sales declined from over 350 in Q1 to less than 200 in each of the remaining three quarters. At present, there are more than 2,000 unsold condos priced over $5M in nearly 150 buildings and nearly 800 above $10M in 100 buildings.
Also striking is that while the number of units sold in Manhattan from Q1 to Q2-4 plummeted from 353 to fewer than 200, the price of the average deal remained steady at $3.7-4 million in Q1, Q2, and Q4. It even jumped to more than $6 million in Q3, driven by a couple large deals (220 Central Park South, 520 West 28th, 53 West 53rd).
By contrast, the average price of Brooklyn deals held level at about $1 million. Queens deals averaged $796,000 to $866,000. This underscores why it has been so difficult for Manhattan developers to close on new condos: They just do not have the sub-$1 million inventory Brooklyn and Queens developers can move in a tough market for sponsors.
A Tale of Two Boroughs
Buyers are flocking from Manhattan’s costlier digs to Brooklyn and Queens. Instead of foreign buyers driving the market by closing on $4+ million apartments, local buyers are increasingly setting the pace for developers with $1 million purchases in smaller buildings.
Brooklyn boasts more buildings of this size than Manhattan and Queens. The number of Brooklyn condo buildings with sales varied from 112-132 across the four quarters of 2020. The range dips to 63-81 in Manhattan and 30-40 in Queens.
Astoundingly, Brooklyn new developments sold more units than Manhattan last year. While Brooklyn’s overall condo sales trailed Manhattan’s by 7%, the borough sold 35% more units than Manhattan in new developments. New condo sales in Queens reached 76% of new condo sales in Manhattan.
Brooklyn already outpaced Manhattan in Q1 (387 new units to 353, a difference of 9.6%), but Brooklyn sales beat Manhattan’s by margins of 39% and 49.5% in quarters three and four, respectively. This shows that COVID widened a gap between Brooklyn and Manhattan’s new condo markets that had already materialized in Q1. As for Queens, the borough struggled in Q4, but it sold just 31 fewer condos than Manhattan in Q2 and even more than Manhattan in Q3.
Including listed and shadow inventory, Manhattan sponsors have 7,600 newly developed condos on their hands. Brooklyn has 3,690. At the current pace at which condos in each borough are selling, it will take Manhattan eight years to unload its current inventory. It will take Brooklyn four years and Queens just over three.
Clearly, it was a relatively tough year for Manhattan real estate, and the borough has been fighting adverse trends for the better part of four years. However, Manhattan has still seen some major successes. 220 Central Park South has defied the trends, and 130 William Street has dominated sales below 14th Street.
Brooklyn and Queens Standouts
Brooklyn sales strength primarily rested on smaller buildings in neighborhoods that have seen success for more than a decade, including Bedford Stuyvesant, Crown Heights, Bushwick, East Williamsburg, and Greenpoint.
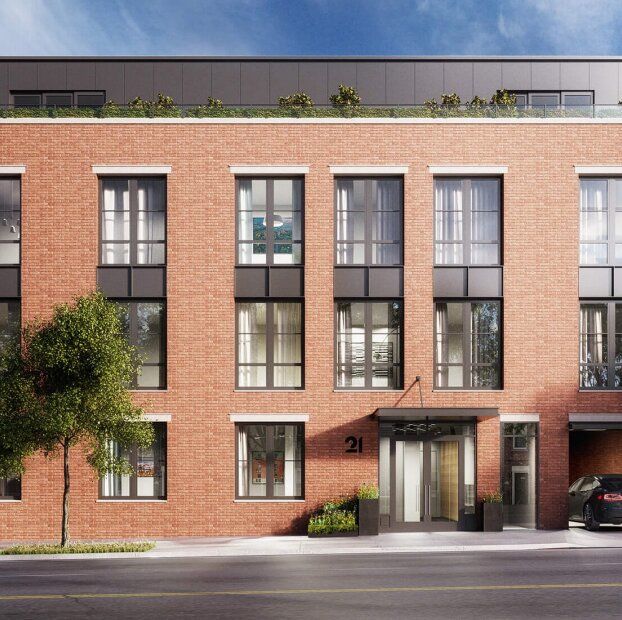
Consider 21 Powers Street in East Williamsburg. The new development has sold 12 of its 14 units since sales began in September 2018. All sold for between $789,000 and $1.74 million. The building offers eight one-bedrooms, and its six two-bedrooms come with the modest average size of 1,087 sf. It effectively targets the kind of buyer driving today’s market.

Two other Brooklyn success stories are Museum House in Crown Heights and 813 Jefferson Avenue in Bedford Stuyvesant. (Also check out our previous coverage of The Luxe, which has all of its 49 units in contract).
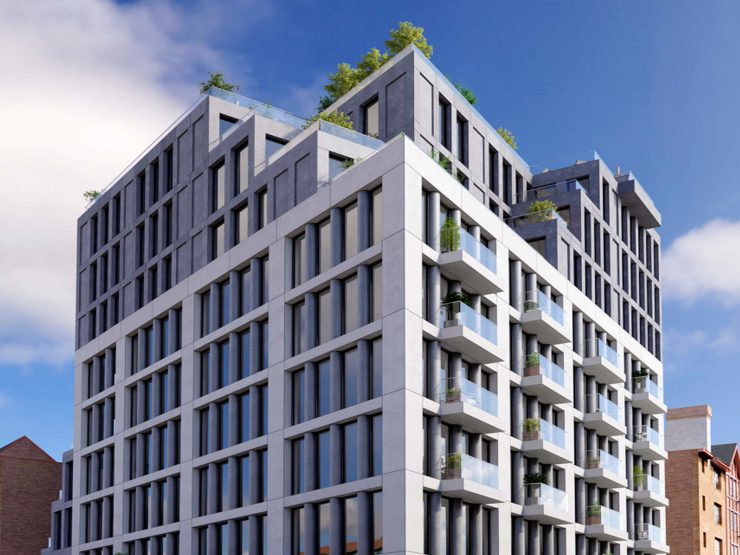
Museum House has sold 87% of its 37 units, closing on 54% of them in 2020. Sales started just two years ago in January 2019. Prices varied from $800,000 to $2.6 million, and 27 of the 37 units are one-bedrooms or two-bedrooms. The latter are 1,062 sf on average. Again, Museum House’s strong 2020 attests to the preference for modest condos in popular but still up-and-coming neighborhoods.
813 Jefferson Avenue has closed on seven of its eight units. All but one of those units sold for $565,000 or less. The asking price for the final unit is $599,000. One unit is a 484 sf studio; the remaining seven are one-bedrooms that average 648 sf. The success of 813 Jefferson in a year of tight finances should come as no surprise.
In Queens, Galerie at 22-18 Jackson Avenue in Long Island City is a standout.
Galerie sales began in January 2018. Since then, the building has sold 136 of its 182 units, or 75%. Many of these sold for $1 million or less, and sales start as low as $575,000. The average apartment size is small: 506 sf for the 29 studios, 680 sf for 78 one-bedrooms, and 1,104 sf for 47 two-bedrooms. Thirteen of the 46 remaining condos, or 28%, are three-bedrooms. Yet three-bedrooms only account for 15% of the total units.
Finally, Murray Hill’s Changan Tower closed 86% of its 22 units in 2020 alone. The Queens condo includes 22 two-bedrooms with an average size of 968 sf. It has sold units for between $350,000 and $640,000. Sales began exactly one year ago in January 2020, and one might have anticipated trouble for the new development after COVID turned society upside down in March. But it turned out that Changan Tower’s modest prices met the moment.
Takeaways
The Brooklyn new development market is selling units faster than Manhattan’s. Queens is catching up. The main force behind the shift is hunger for lower prices.
One of the factors driving that decreased appetite for condos worth $2 million or more is COVID, as one might expect. The Manhattan market took a hit after this year’s first quarter.
The other two factors precede COVID. They are, first, the ascension of the Trump presidency. That appeared to rattle international buyers, who had been investing in pricey Manhattan inventory. Their purchases have declined nationwide since 2017. Secondly, the introduction of a new, progressive mansion tax further scared off high-end buyers.
Thus, it would be unwise to view Brooklyn and Queens’ emerging strength relative to Manhattan as a passing, COVID-specific trend. This trend is likely to endure, even if a new administration and COVID vaccines slow the rate of change. The balance of real estate power in NYC is shifting among the boroughs.
Getting started with Marketproof
With Marketproof New Development, you can easily search both publicly listed properties and unlisted off-market properties not available on popular listing sites. Marketproof can increase the inventory you see by 9-10x what you may see on other sites. Create an account today and get a 7-day free trial.
Top photo courtesy of Museum House.


